As volatility and complexity increase in European energy markets due to the rising prominence of renewable energy, traditional manual trading – although good at times – is currently not enough to capitalise on the new ‘wave’ of opportunities available. We are now seeing the rise of automated and algorithmic trading on the energy markets in continental Europe, the Nordic countries and Great Britain.
In this series of articles focused on algorithmic trading in European energy markets, we are going to explore the key drivers behind market changes, maturing trends and how energy traders and asset optimisers can gain competitive advantage.
In this first article, we focus on the GB market.
Revenge of the CO2
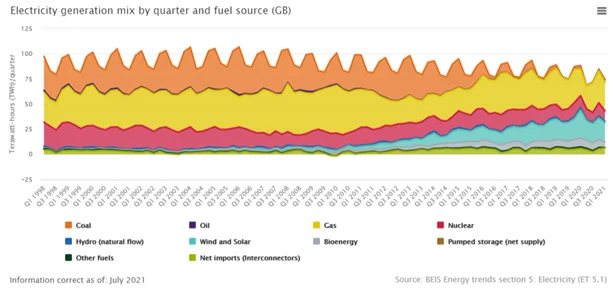
From 20 years of relatively slow and steady developments, to a sprint of unprecedented transformations, the GB energy market has drastically changed its “green economy” narrative in the last couple of years. It has accelerated towards a greener and more sustainable energy mix. As renewable generation (on- and off-shore wind, solar, biomass, etc.) takes off share of conventional generation (such as coal and gas) in the energy stack, the amount of CO2 entering the atmosphere is decreasing – to the benefit of people and environment. However, a typical energy trader, using traditional energy trading tools, would argue that not everything is so bright – at least not for them.
A typical day of a typical energy trader looked quite repetitive 5 years ago: arrive into the office, take over from the previous shift, submit day-ahead volume nominations, manually optimise assets for the rest of the day via internal and external trading, try not to leave too much volume into imbalance. An experienced trader could complete such activities manually, based on their judgment – and still have time left for 3 or 4 cups of tea during a 12-hour shift.

Source: https://www.ofgem.gov.uk/energy-data-and-research/data-portal/wholesale-market-indicators
However, more renewable generation brought in an extra dimension – intermittency. Unlike gas or coal generation that could be made available at a flick of a switch, renewable energy is heavily dependent on weather. For context, day-ahead temperature and wind speed forecasts are on average wrong 8% and 9% respectively. As renewable generation is unreliable and difficult to predict, its gradually increasing share in the energy mix led to higher price volatility and challenges when balancing.
As a result, the energy market became more complex, the number of tradeable intraday products grew, settlement periods became shorter (from 60 minutes down to 15 minutes in some European countries) and intraday wholesale prices became more volatile. Negative imbalance prices – a strange, yet real phenomenon when a trader has to pay to sell (generate) electricity, and is being paid to buy (consume) electricity – have become the new norm.
These days, a trader typically has to optimise 48 or 96 periods instead of 24, seek arbitrage opportunities, beat Volume Weighted Average Price, predict Net Imbalance Volume and decide how much volume to leave for imbalance, optimise charge-discharge strategies for batteries and ancillary services – and, if they are lucky, find time to brew that one cup of tea per a 12-hour shift.
The New Hope
The rise of algorithmic trading coincided with the rising complexity of the energy market. The business case for algorithms is simple – to help energy traders and energy asset optimisers efficiently balance their portfolios and extract value from the ever-changing market. Here are a few reasons why more and more trading companies started to adopt automated processes and are looking ahead to the benefits of algo trading:
1. Analyse price patterns, predict price direction and act on it. Moving average cross-over, mean reversion, convergence-divergence, relative strength index, etc. – these and many other strategies have found their application in financial markets, and likewise can be applied to the energy markets too. However, since energy contracts are non-rollable with multiple expiration times per day, a trader needs to understand the industry context before modelling such data.
2. Getting in and out of positions quickly. In volatile markets, first come first served is the dominant principle. With 48 products to balance simultaneously, a human trader simply does not have the attention span required to spot such opportunities.
3. Find and act on mispriced opportunities. The concept of fair value is common in the energy markets – more so on the curve, but also in day-ahead nominations. Many traders have to calculate clean and dark spark spreads manually several times a day to derive the implied spread and implied fair value in periods of low liquidity. Being distracted in this, they may miss rare mispriced “easy money” opportunities, especially when trading multiple products at the same time.
4. Trading asset optionality. Akin in the stock market, each power generation asset can be treated like an option with its strike, premium, calls and puts, delta, gamma and other Greeks. Options are complex instruments. An algo can help a trader simplify option trading strategies and calculate the probability of success of different outcomes to mitigate risks.
5. Act on arbitrage opportunities. Be it a gas storage, a battery, an interconnector – trading arbitrage opportunities is a simple, lucrative, yet gruelling strategy, as it requires a lot of attention to detail and constant observation of the market. Certainly, algorithms can simplify that task.
The challenge: Liquidity Strikes Back
In an illiquid slow-paced trading environment it is hard to justify using an algorithm – a person can make a right decision themselves in a timely manner. However, in a liquid fast-paced environment an algorithm will spot opportunities that even an experienced trader may miss – especially in the energy market with 48 non-rollable products to trade simultaneously. Hence volume churn is generally regarded as the most influential factor for algo trading adoption.
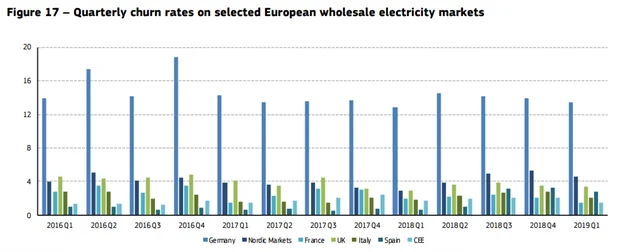
According to Ofgem, “churn is one metric used to assess market liquidity”. It shows how often a unit of electricity is traded before it is delivered to end consumers. Liquidity is an important feature of mature markets, often reflecting a large number of buyers and sellers. Liquid markets also facilitate new entry by making it easier to buy and sell electricity at a good price. For example, in a liquid market a new supplier or generator can more easily enter the market and buy or sell electricity”, making the route-to-market shorter, bypassing the middle man, saving on brokerage fees and likely achieving a better spread.
The truth is, some European countries have a much bigger churn than others and thus present more fruitful opportunities for algo trading.

The chart above shows that on average and as of Q1 2019, Germany had a churn ratio of around 14, followed by the Nordic Markets and GB (churn fluctuating around 4), Spain (churn recently jumping to 3), Italy (churn around 2-3), concluding with France and the Central and Eastern Europe countries with churn ratio of 2 each. A noticeable difference between the leader and the rest gives food for thought. The German energy market is 3 to 7 times more liquid than other regional markets – unsurprisingly, it is also pretty saturated with algorithmic trading solutions.
Nonetheless, other regional markets are the ones that represent the upside in terms of liquidity. Since algorithmic trading facilitates liquidity, increased liquidity in turn encourages more algo trading – hence it becomes a cycle that can boost liquidity to the benefit of all market participants.
Pandemic: Return of COVID
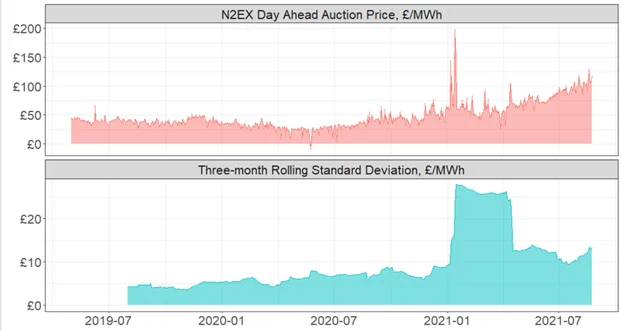
After the lockdown was introduced in March 2020, national electricity demand in GB fell nearly 20% – as did the wholesale prices. Summer 2020 was marked by fairly low day-ahead power prices of £25/MWh. Nonetheless, although prices remained relatively low, volatility of day-ahead prices accelerated from £5 to around £8/MWh amidst growing demand uncertainty, as depicted in the chart below.
Volatility in this case is represented by a three-month rolling standard deviation. According to economic theory, when prices move wildly, standard deviation is high, meaning an asset is risky. Low standard deviation means prices are calm, so an asset comes with low risk.
The flat-to-bearish price trend reversed to the upward momentum in November 2020, supported by successful developments of the COVID-19 vaccine. It took a few weeks for the day-ahead wholesale prices to double. Volatility gained momentum too, as it reached £10/MWh by the end of 2020 – twice as much as in the turn of 2020.
Then came cold winter in Asia and limited LNG send-outs to Europe, which boosted prices into a three-digit territory and increased volatility 2.5-fold. Although the bubble burst quickly, depleted European gas storage and political tensions around the Nord Stream 2 accelerated demand recovery on the back of growing vaccination rates in GB. This provided fundamental support for the day-ahead power price at the £75/MWh mark.
However, approaching winter, uncertainty around gas availability in Europe and relatively low wind output in GB guided power prices above the 3-digit territory once more. Volatility of day-ahead power continued to fluctuate between £10 and £15/MWh – suggesting that in a matter of 15 months, GB power has suddenly become 3 times riskier to trade, and markets have changed.

Source: Nord Pool, Brady
More risk usually implies higher potential reward – or higher losses. In such a rapidly changing context of the energy market, a trader will likely benefit from a solution that may help them navigate through volatility. Reliable trading software that provides algorithmic trading capability – like Brady PowerDesk – could become a viable go-to option.
The future
Based on experience in more liquid European markets – e.g. Germany, it seems that the scope for algo trading growth has a significant upside in the rest of Europe and GB as markets become more mature. There are exciting times ahead, especially as the “green” agenda continues to remain one of the top priorities across the globe.
The author

Dmitrii Ishutin is a Quantitative Analyst at Brady. Dmitrii leads development of the advanced analytics module of Brady’s SaaS product for short-term energy traders – PowerDesk Edge. Dmitrii has over 5 years of energy industry experience. Before Brady, Dmitrii worked at EDF Energy (the largest energy company in the UK) as a trader on the curve trading desk where he managed long-term power and carbon hedging for both consumption and generation arms of EDF. Before that, he was a senior data scientist in the volume forecasting team.
In his spare time, Dmitrii trades his own portfolio of stocks and crypto, and is preparing for the Level 1 of the Chartered Financial Analyst exam.


